This is a hodge-podge of ideas that did not make it into the full discussion on Climbing Grades. I apologize for the lack of organization here.
My Frustration with Grades
I want to be sports fan of climbing, and I want to know if Daniel is the 🐐, but how would I? The hope is that a climb labeled the same grade as another should have comparable difficulty. Complications arise because many factors can affect the difficulty an individual experiences on a climb: one’s physiology, the weather, the number of movements required, the climber’s technical competency, strength capacity, and the equipment used all contribute to the experience of difficulty for any given climb. Disagreement on grades commonly occurs, which may lead one to the conclusion that the current grading system is flawed or at least not fully understood.
Currently, climbers’ achievements are not easily comparable. If climber and climber both say that they have climbed boulders at a grade of “V”, then can it be said that they both have accomplished similarly difficult feats? While it is tempting to give a definitive answer, teasing out the truth is complex. While comparing accomplishments may not be the only purpose for grades, it is a part of their purpose and how they are used today.
Beyond just evaluating elite climbers at the top end, many climbers care about the grades they choose to take for particular climbs. It has become more commonplace to consider “personal grades” where each person decides what grade is appropriate to describe what they experienced on the climb. Is that the right thing to do? Or should you just take the same grade that most others do? These are philosophical questions at one level, and also on another perhaps grades don’t matter to us mere mortals.
A Short Discussion on Modeling
Translating real world phenomena into a mathematical model is both an art and a science. The goal is to capture the fundamentals of the system. This is a balancing act of keeping the model simple enough that it is not prone to over-fitting without losing the complexity of the true system. With climbing grades this process has occupied my brain for a decade and a half. What is a climbing grade? For most people it is just a number, but can a single number really capture the nature of the difficulty that a climb poses to a climber?
The variability in grades suggests that grades are not a constant, i.e., a single number is not sufficient information to describe the system. While this demonstrates that the model of a single number is flawed, it can still be useful. Often we use functions that take complex phenomena and give back a simple number. In math, the most general form of this idea are [functionals](https://en.wikipedia.org/wiki/Functional_(mathematics), but you may be more familiar with norms or projections. At some level grades should share the same purpose. They are trying to encode information about a climb’s difficult in a single number. Currently, if anyone wants to know how hard a climb the clearest picture is provided by looking at logbooks of other individuals’ reported grades. As a rough estimate, this helps inform whether one would like to try a particular climb, and this gives the gist about the difficulty. Overall this is a relatively time intensive process, and it provide less than adequate information. Thus motivating something new.
There are many directions that one could take when developing a new model for describing the difficulty of a climb. For instance, one could stratify components of climbing and give a grade to each one. For instance, each climb could get a flexibility, skill, and strength score. This would give a multidimensional picture of the difficulty of each climb. This stratification could be as simple as these three categories or could be done ad nauseam. Climbing difficulty is multidimensional and a model that takes this into account is attractive but projecting the difficulty onto one-dimension allows for easy comparison between climbs. Also, extending the existing one-dimensional grade allows us to leverage the existing data more transparently. Then we can compare with the old way of thinking about grades to the new easily. Culturally, this approach may be more widely accepted because it is in line with the history of the sport.
Choice of Continuous or Discrete Random Variables
While it has been discussed why and how a one-dimensional stochastic model was chosen, it has not yet been specified whether a discrete or continuous model is used. A continuous random variable can take on values such as 3.0, 3.1, , or any number in between, and discrete random variables take on values predetermined. Depending on the distribution, a discrete random variable could take on values of “V0”, “V1”, “V2”, and so on, but a climb could not be “V3.5”. In practice it may be advantageous to discretize climbing grades because it is often difficult for individuals to accurately differentiate between a “V5” and “V6” let alone a “V5” and a “V5.1”. This can help mitigate the measurement error we discusser earlier. For the time being I assume that the random variables are continuous for ease of computation, but I am not convinced that on principle this is the best choice.
Also, it is possible that bias may be on a scale larger or smaller than the precision of these measurements. That all said, modeling grades on the continuum probably better describes climbing grades. For starters, this could help explain the common experience of one climb feeling noticeably harder than another while both are decidedly the “V” grade. Hence, climbing grades are modeled here as continuous random variables.
Todo
After discussions with another mathematician, Dr. Jennings, I would like to look at using catagorical distributions for and . Dale and I also think this clearly shows that there is a nonlinear rounding operation occurs when reporting data. This makes it more advantageous to keep all RV’s as discrete.
How then are grades distributed?
There is a choice of distribution for both the experienced difficulty, , and the bias, . As with many scientific applications, it would be convenient if these random variables came from well-known distributions. The most familiar distribution being the normal distribution. While specific statistics are guaranteed to asymptotically converge to known distributions, a pertinent question remains. How does experienced difficulty and bias behave?
Info
When enough samples are collected the mean of samples is another random variable that is distributed normally. This is known as the Central Limit Theorem.
Example
Above are candidate distributions for a hypothetical “V5”. All have a mean grade of “V5”, but with different behavior.
While the normal distribution is how most readers may first conceptualize a grade viewed as a random variable, there is good reason to think that the experienced difficulty could be distributed in a variety of ways. In this paper, the uniform, the normal distribution, the Gamma distribution, Gaussian Mixtures and Kernel Density Estimates (KDE) are considered.
Uniform distribution is describe equally likely outcomes over an interval, and there is an argument to be made that when someone says that a climb is V, then the grade would take on the distribution if Uniform(,).
The Gamma distribution was chosen as a candidate because of the possibility of asymmetry. Thus a Gamma distribution better describes a climb where most people feel the climb easy for “v5”, but with a non-negligible minority experiencing the climb much more difficult for the grade.
Gaussian Mixtures are conceptually what they sound like, a weighted sum of Gaussians. This can allow for multi-modal distributions which better describes a climb where 60% feel the climb is around “V3”, but 40% feel the climb is around “V8”. This could be because the climb is such that it significantly advantages a specific morphology, which is generally outside the climber’s control. In this case, a unimodal distribution would poorly describe the data, so a distribution like Gaussian Mixtures is an attractive option.
KDE’s are a general tool used to construct a continuous distribution to fit data. This is done by convolving the data with a kernel. In this study a Gaussian Kernel is used. KDE’s allow us to fit arbitrarily well to the data, so that model mismatch is not a concern.
Extending to Conditional Distributions
Conditional probability is a powerful tool. It allows us to move from considering something random to it becoming fixed. For this application, a conditional distribution would probably be the most useful version of this model. We can define a new random variable that conditions on the climber being you and the conditions being however it is right now. If we condition on all the random components, and we assume that measurement error is negligible, then this hypothetically could get us back to a single number, a grade. If we could be so lucky. Estimating this distribution is harder because there probably is not a lot of data on just your climbing, unless you are Austin Purdy. There are tricks we can play to try and figure out who agrees with you implicitly, then leverage the data of others who think about grades similarly. I did this to build an algorithm to suggest climbs at a particular grade for me to try while in South Africa. Maybe I should do a write up on that as well? We will see…
Assimilating weather data into the estimate might be possible… I have played around with it. It seems like someone would need to pay me to do this for it to be worth it.
Bias
Reporting bias is prevalent in my discussion of climbing grades, so that it can be removed to isolate an estimate of experience difficulty. This poses some challenges because bias may not be random at all. Depending on the individual, the bias they bring into their reported grade could be a function of personal complaint specific to the climb, or a particular conceptual position regarding grades in general. Furthermore, anthropological or psychological reasons contribute to bias. Human beings are prone to social influence and exposure to grades proposed by other climbers may affect the grade another climber chooses to report. Bias of one climber may not be independent of other climbers’ bias.
Some reasonable motivations for bias are wanting others to think more of an individual accomplishment and thus incentivizing the inflation of a reported grade. Alternatively, a climber may feel incentivized to report a grade as easier than what they experienced as a way to downplay others’ accomplishments. This is commonly referred to as “sand-bagging”.
Also, there is a built-in incentive with 8a.nu to take the higher grade because of the ranking system. 8a provides a rolling ranking board for each country and the world. Each climb is given a point value with extra points for doing climbs as a first ascent or in one or two tries. This motivates climbers to report climbs a grade that is more difficult than they actually believe that it is. This also has created a counterculture movement that is vocal and creates media that publicly shames others for trying to maximize their points on 8a by misreporting. In many circles taking a lower grade is applauded because it demonstrates to one’s compatriots that they are at a level where a climb feels easier than what others say.
While it is up for debate which is more ethically or morally corrosive, both are inherently dishonest. It is worth reiterating that these biases may be subconscious and may not be intentionally added. Instead, bias can be present without any conscious ill will. This lack of intention does not preclude existence of bias in reported grades.
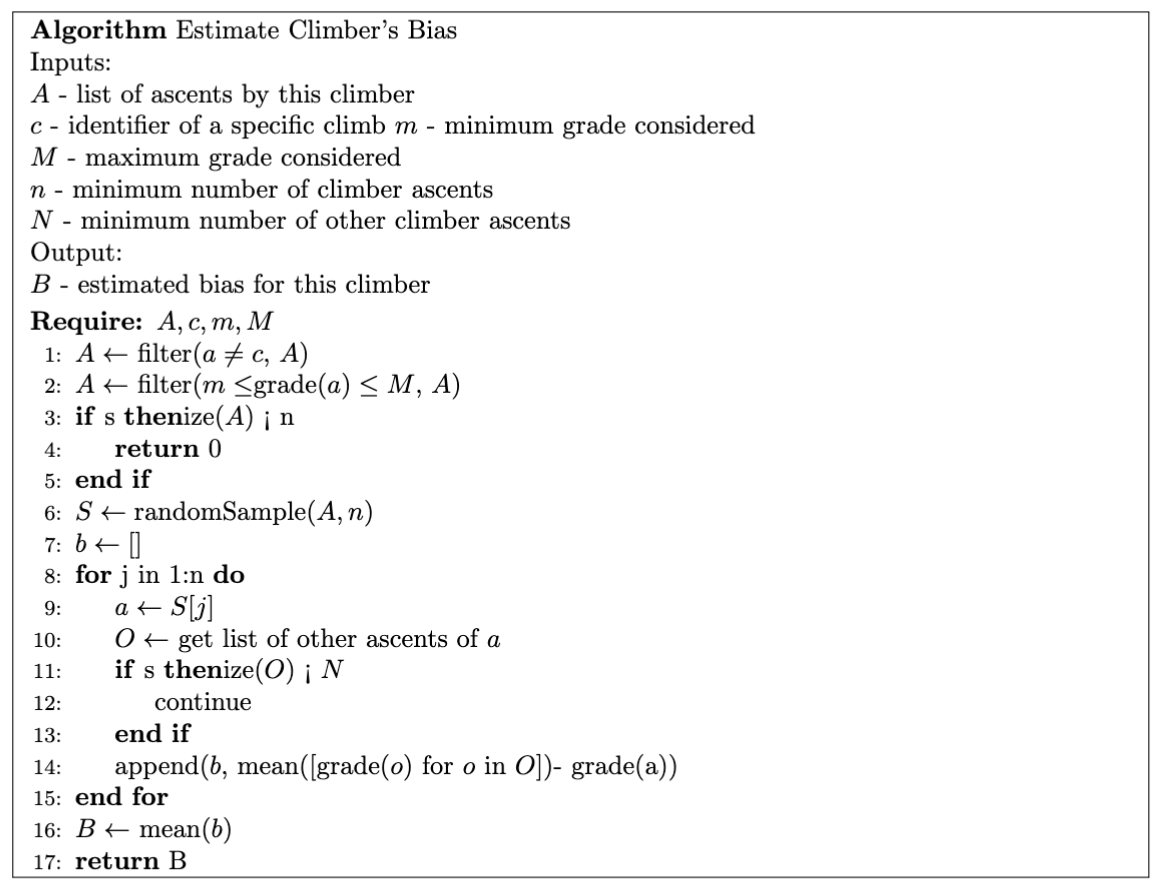
In either case, these non-random motivations create roadblocks for accurately estimating bias for any ascent or climber. Despite these pitfalls, the bias for each individual may be observed and accounted for to some degree. The algorithm used to debias reported grades} is done by estimating the expected (average) bias through by sampling a climbers log book then of comparing the reported grade of this individual to the mean reported grade. Assuming that over the entire population of reports that bias is centered at 0 and random. If this assumption is true, this algorithm should properly estimate an individual’s average bias given enough data. Unfortunately, as discussed above these assumptions are violated. My hope is that this debias-ing process recovers the experienced difficulty with some accuracy.
Todo
After discussions with Dale, I believe we could better recover if instead we write . There is more to flesh out here.
Acknowledgements
This is not just my brain child 🧠👶. Thoughtful conversations, edits and ideas were contributed by: Will Anglin, Carlos Tzacz, Dr. Dale Jennings, Dr. Jem Corcoran , Dr. Stephen Becker, Paige Witter, Sam Struthers, Ethan Rummel, and Jeremy Abraham